
Raydium (RAY)'s impressive weekly gains are met with caution as declining network activity and rising sell pressure raise concerns. While technical indicators point to both bullish and bearish possibilities, traders should remain vigilant.
Raydium (RAY) has experienced remarkable weekly growth, solidifying its position as a top performer within the decentralized finance (DeFi) sector. At the time of writing, RAY is trading at $7.88, showcasing a slight 2.26% daily decrease but maintaining impressive weekly gains exceeding 60%. However, a TD Sequential sell signal on the daily chart has ignited concerns about potential bearish momentum as the price approaches critical resistance levels. RAY's price action presents a mixed outlook.
The token's breakout from the correction area has bolstered its bullish narrative, and the Cup and Handle formation on the monthly chart points towards a long-term trend reversal, suggesting higher price targets. Nevertheless, the current trading range near $8 has proven to be a formidable resistance zone, as evidenced by the recent dip. If RAY fails to surpass this level, a retracement could materialize, raising apprehensions for bullish traders.Despite RAY's price rally, network growth has been inconsistent and is currently trending downwards. The decline in active and new wallet addresses indicates reduced user activity, which could potentially undermine the rally's sustainability. Moreover, this downturn raises questions about the token's long-term fundamentals, despite its strong price performance. Raydium's decentralized exchange volume has surged by a staggering 273% over the past week, reaching a total of $53.68 billion in activity. This milestone underscores growing confidence in the platform, propelling it to the forefront of weekly DEX activity. The robust volume also suggests heightened liquidity, which could attract further market participation. However, traders should exercise caution as such spikes often precede short-term corrections, especially when coupled with bearish technical indicators.Adding to the cautionary note, RAY's supply on exchanges has risen to 3,937, indicating a potential increase in sell pressure. Historically, such movements signal that traders are preparing to liquidate their holdings, which could lead to a price correction. This trend aligns with the bearish sentiment highlighted by the TD Sequential signal, further amplifying the need for vigilance. Traders should closely monitor this development as it could significantly influence short-term price movements.Raydium's breakout and weekly volume growth presented a compelling bullish case, but warning signs such as declining network activity and rising sell pressure necessitate a cautious approach. While the Cup and Handle pattern suggests long-term upside, the increasing supply on exchanges and near-term resistance may trigger a correction. Ultimately, Raydium's ability to overcome these challenges will determine its future trajectory. Will the rally persist, or will a pullback take precedence? Based on current data, a short-term correction appears more likely
Raydium RAY Defi Cryptocurrency Technical Analysis Price Prediction Network Growth Sell Pressure
Canada Latest News, Canada Headlines
Similar News:You can also read news stories similar to this one that we have collected from other news sources.
 Raydium’s domination of Solana DEXs had THIS impact on RAY’s ATHRaydium emerged as the top Solana DEX in fee and revenue terms after achieving a strong lead. RAY's price action and its network...
Read more »
 Raydium Price Analysis: Bulls Eye $9.54 as Liquidation Levels Present Buying OpportunitiesRaydium's price has surged recently, breaking out of a previous range and demonstrating strong bullish momentum. Analysts identify key support and resistance levels, suggesting potential price targets and areas of consolidation. The analysis also highlights liquidity pockets and liquidation levels that could influence future price movements.
Read more »
 Bitcoin Price Rally: Underserved Market Potential Hints at Further GainsDespite a recent price surge, Bitcoin's market momentum suggests potential for further growth. Analytical data from CryptoQuant and Glassnode indicate that Bitcoin remains undervalued and is far from reaching its market top. Decreasing selling pressure and increasing market confidence strengthen the case for a continued upward rally.
Read more »
 ENA Price Forecast: Rally Above $1.46 Resistance to Unlock Mid- and Long-Term GainsAnalysts predict that ENA's price will surge past the $1.46 resistance level, driving significant gains in the medium and long term. The cryptocurrency's technical setup, characterized by a higher low within an ascending channel, supports this bullish outlook. Key Fibonacci retracement levels and resistance targets indicate potential price increases towards $1.6373, $2.1521, and even $2.6178. This positive momentum is fueled by large transactions and a sustained interest in the asset.
Read more »
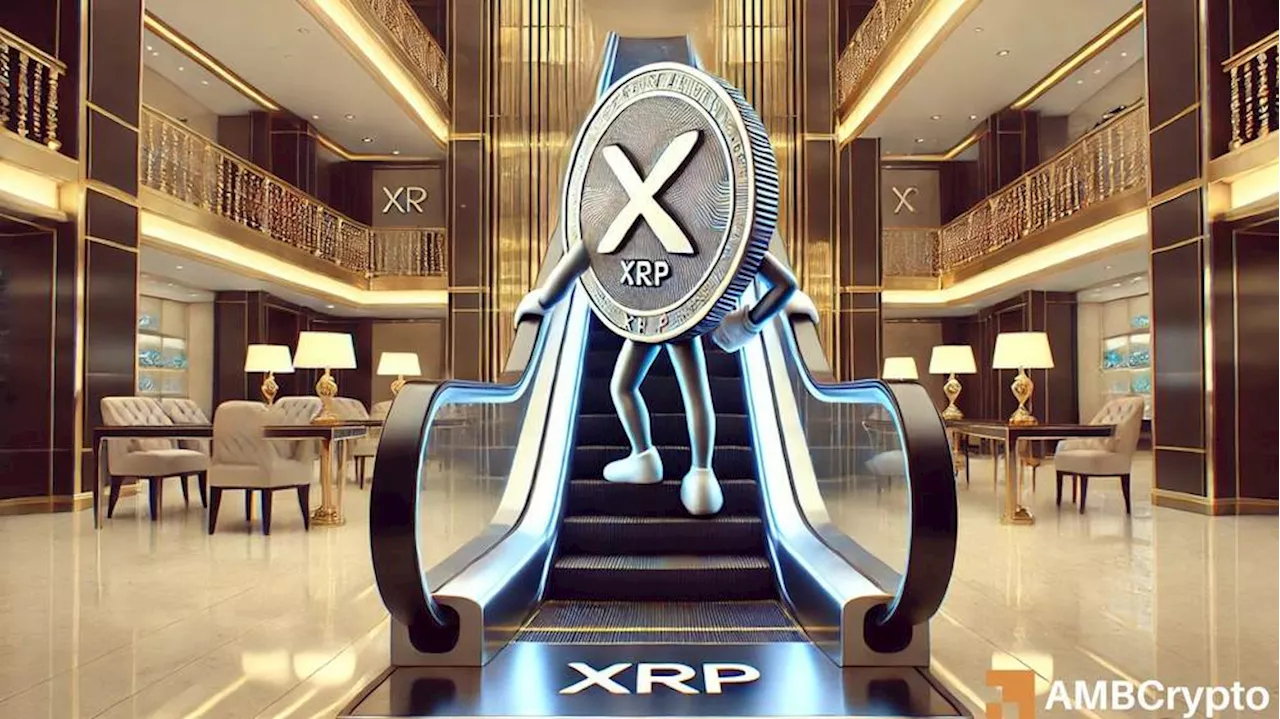 XRP Price Prediction: $500B Market Cap and $8.7 RallyCrypto analyst predicts a 262% price surge for XRP based on a bullish flag pattern. Low selling pressure on exchanges indicates strong confidence in a potential rally. XRP could reach $8.7 if Brandt’s prediction of a $500B market cap is realized.
Read more »
 Stellar Price Rally Faces Potential HeadwindsStellar (XLM) price surge fueled by a golden cross faces potential challenges from weakening technical indicators and declining market sentiment.
Read more »