
ADA's buying momentum falls as it nears a critical supply zone. Key metrics hint at a breakout, but the RSI raises the risk of decline
While ADA has been trading within a bullish symmetrical channel, momentum is building toward a breakout—but significant supply looms ahead.has seen in stagnation over the past week and month, posting similar gains of 3.65% and 3.69%, respectively. Yet, a shift may be underway, with ADA up 4.94% in the last 24 hours.
This supply zone ranges from $0.3680 to $0.3823, which ADA must break through to reach its target of $0.4158. At press time, Open Interest has risen by 6.49%, reaching $252.62 million. This increase suggests continued bullish momentum, historically correlated with upward price trends.
Canada Latest News, Canada Headlines
Similar News:You can also read news stories similar to this one that we have collected from other news sources.
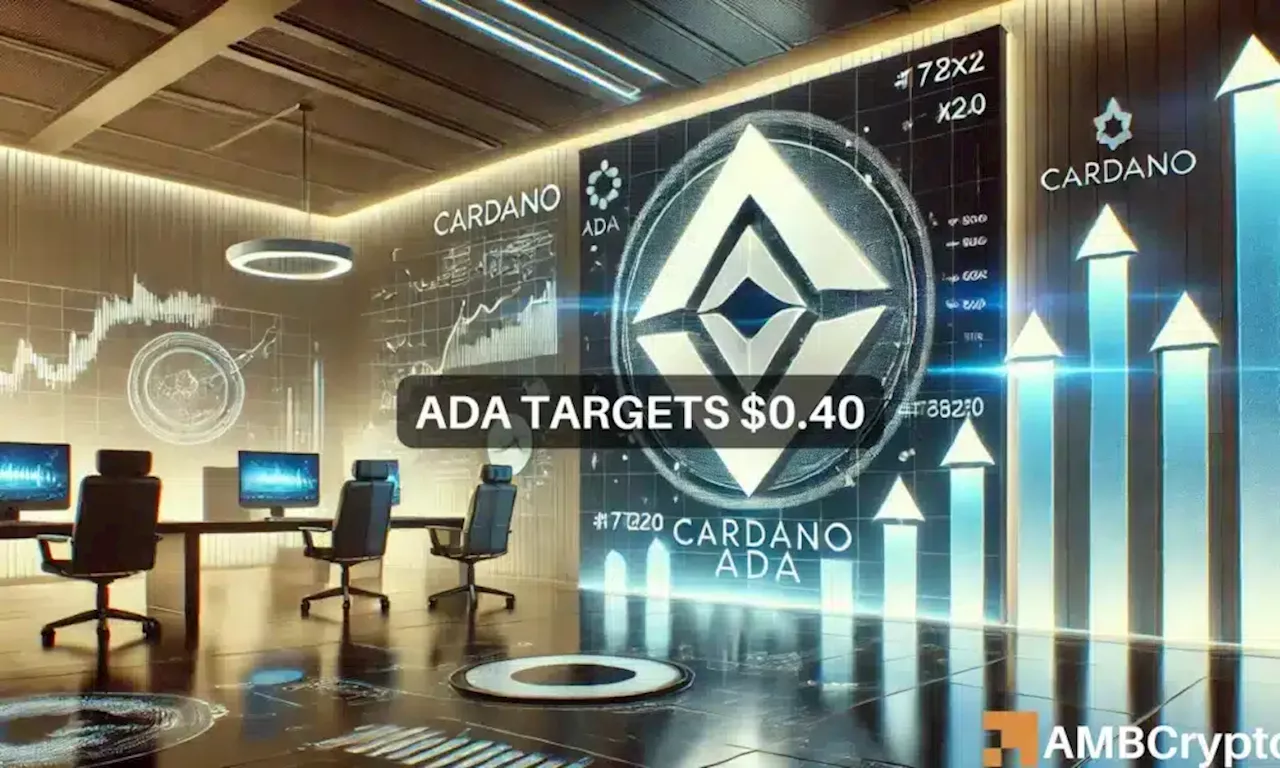 Cardano rebounds: Can ADA break out toward $0.40?While Cardano (ADA) is seeing gradual rebound in price, a technical pattern on the daily chart is suggesting further gains for the asset.
Read more »
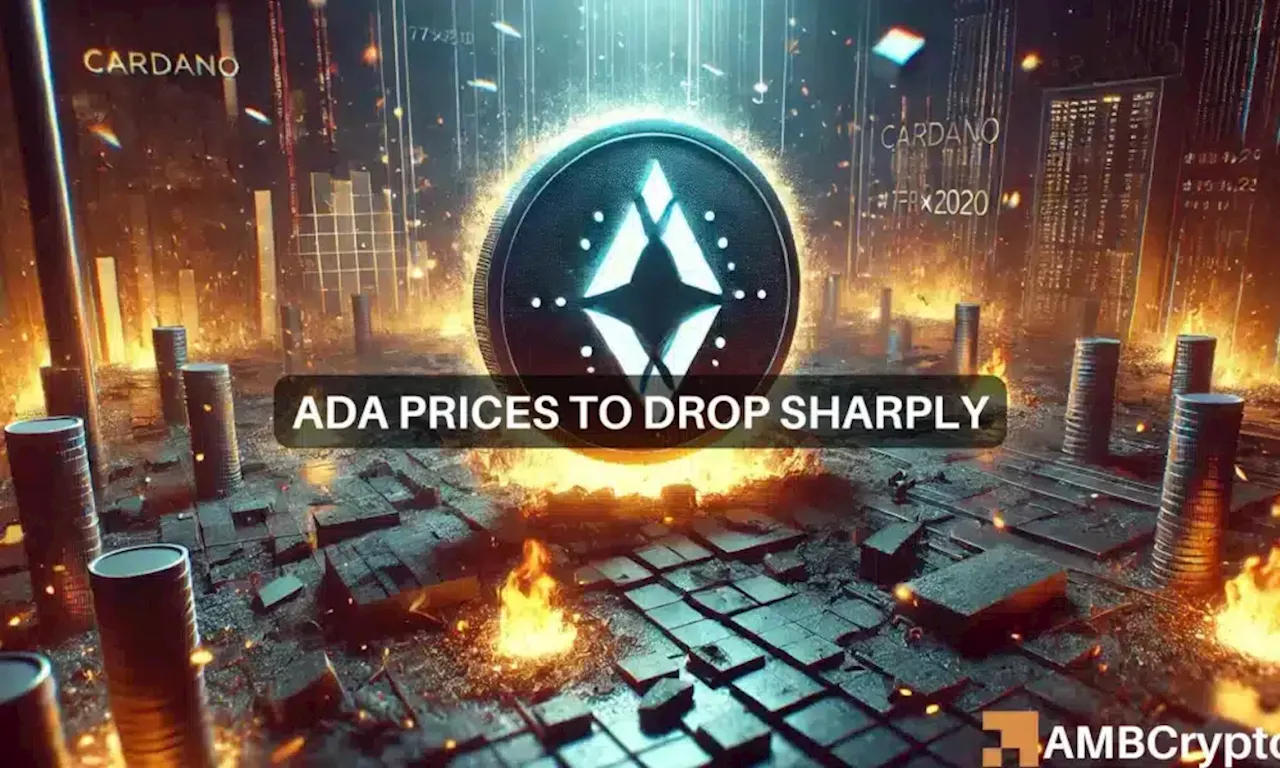 Cardano’s bear trend persists as THIS pattern emerges – Will ADA hit new lows?Cardano (ADA) is showing signs of a strong bearish trend as a double top pattern appears on the one-day chart.
Read more »
 Cardano approaches $0.40: Can ADA rally past this level?Cardano [ADA] is capturing the attention of investors, as both crowd and smart money sentiment reflect a strong bullish outlook.
Read more »
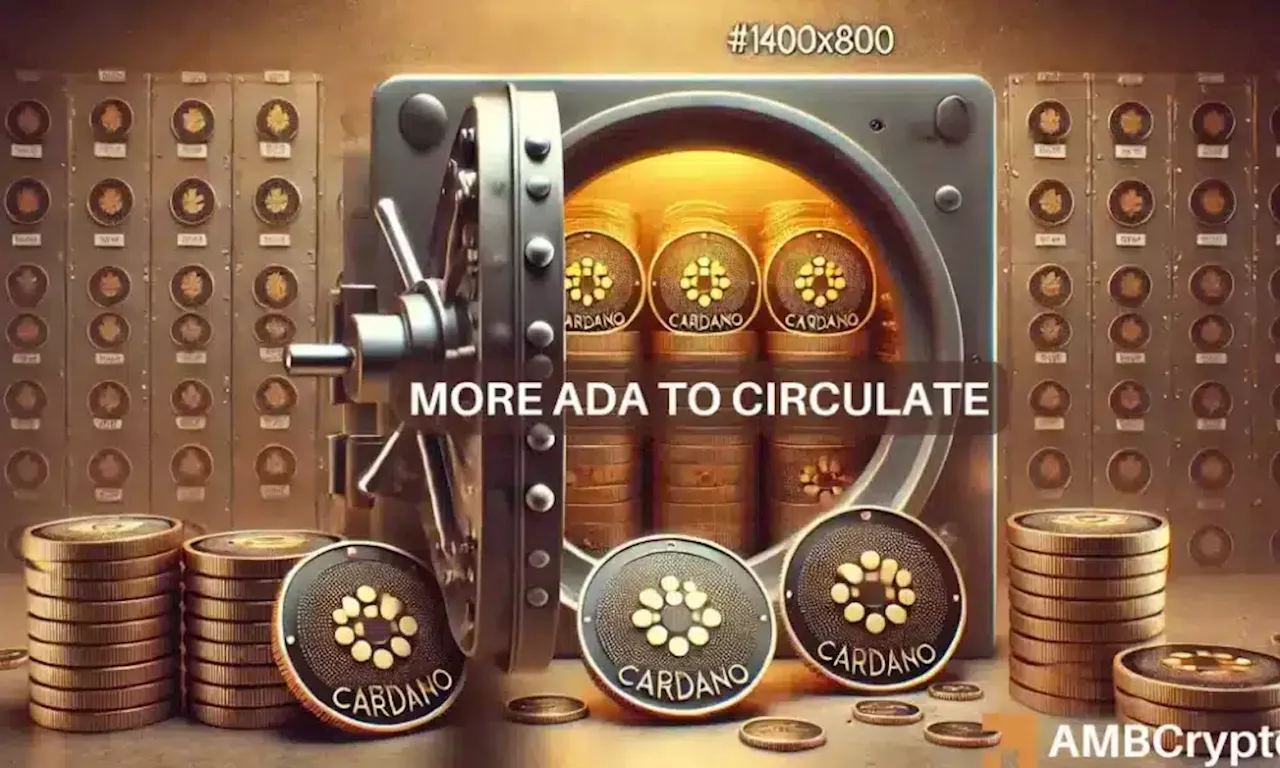 18M ADA unlock: What this means for Cardano’s crypto standing!Cardano is set to unlock over 18 million ADA tokens in October, as the price starts the last quarter of the year with bullish momentum.
Read more »
 Cardano’s balance at record lows – Will this metric spark an ADA reversal?Cardano's balance measured in USD has been declining over the past 30 days, as ADA struggles to break out of a symmetrical triangle pattern
Read more »
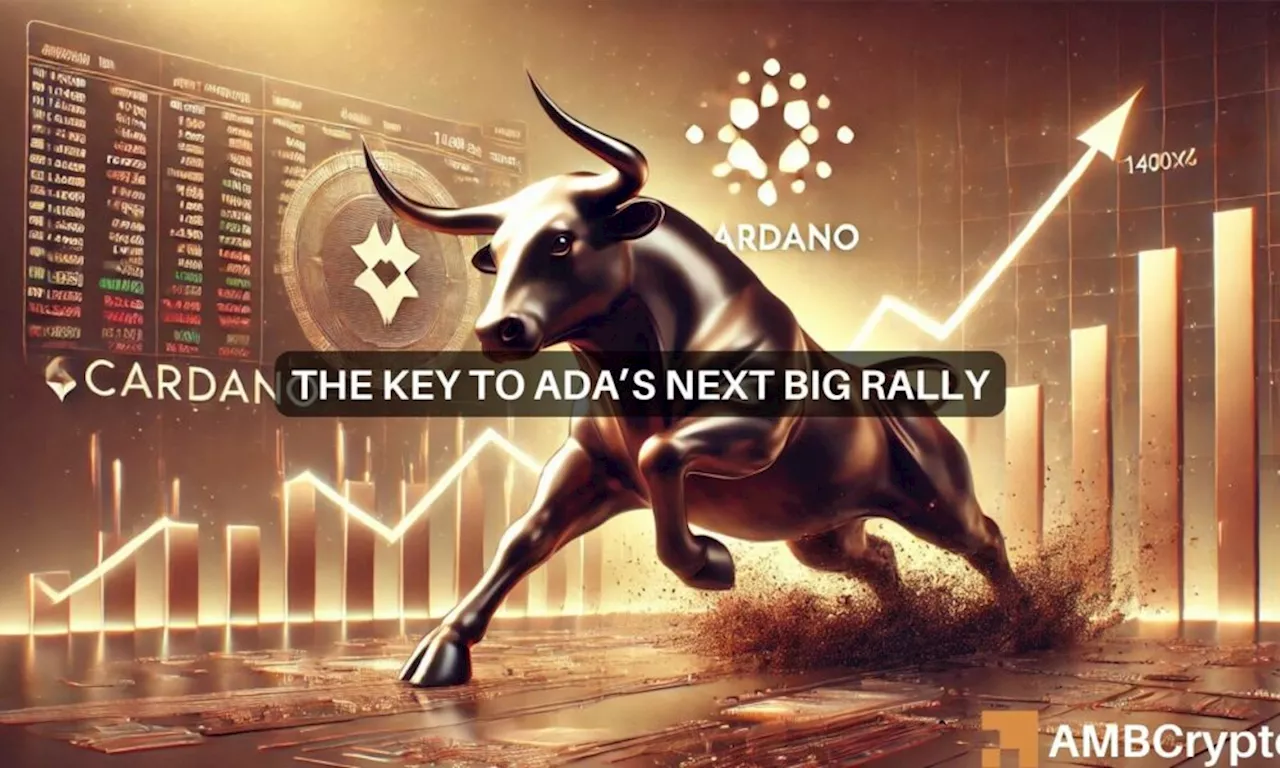 Cardano: What ADA needs to break out of the ‘neutral’ zoneADA is on the edge of a potential breakout from a symmetrical triangle pattern on the 1D chart, a key moment of possible price volatility
Read more »